
USDA Hardiness Zones in Illinois
A Guide to Successful Gardening
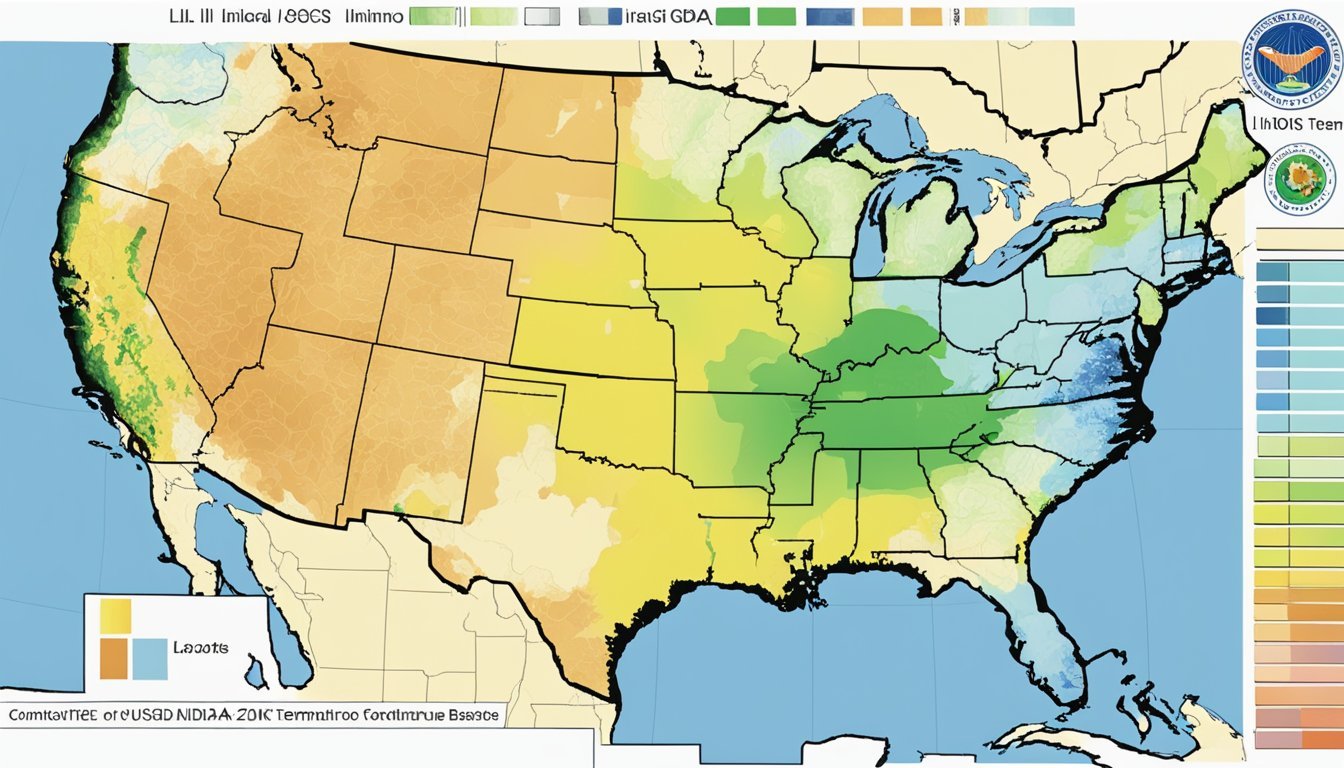
Understanding the USDA Plant Hardiness Zone Map is crucial for gardeners, landscapers, and agricultural planners in Illinois. This map represents a guiding framework for selecting plants that are likely to succeed according to regional climatic conditions. The zones are delineated by the average annual extreme minimum temperature, defining where a plant can survive the cold of winter. It is an essential tool for making informed decisions about planting and ensures a greater likelihood of growth success.

The state of Illinois spans several hardiness zones, due to its varied climate ranging from the cooler, northern areas to the more temperate south. Changes over time have been documented by the USDA, indicating shifts in these zones. This reflects historical temperature data and suggests an influence from broader climate trends. Gardeners in Illinois are encouraged to consult the most current 2023 USDA Plant Hardiness Zone Map to select plants that are best suited for their specific region.
Accessibility to the detailed breakdown of zones within Illinois is made easier with resources like interactive maps. These resources provide a localized view, offering insights down to the level of individual counties or even zip codes. By referring to resources such as the Illinois Interactive USDA Plant Hardiness Zone Map, residents can make well-informed choices about their gardening and agricultural planning.
Overview of USDA Hardiness Zones

USDA Hardiness Zones are critical for gardeners and agriculturists in the United States to determine plant viability based on geographic climates. An understanding of these zones facilitates informed decisions about which plants can survive and thrive annually within specific locations.
Defining Hardiness Zones
USDA Hardiness Zones are geographical areas defined by the average annual extreme minimum temperature. The USDA Plant Hardiness Zone Map divides the country into 13 zones, each zone representing a 10-degree Fahrenheit difference in the average annual minimum temperature. The zone system aids in landscaping and agricultural planning by indicating the climate stress a plant species can endure.
Understanding the Zone System
The Hardiness Zone System assigns a zone number to each area within the United States. For example, a plant labeled for Zone 5 will likely survive winter in areas with temperatures no lower than -20 to -10 degrees Fahrenheit, the defined range for this zone. Tags on perennial plants often use these zones to inform buyers about the suitable climate for planting.
History of USDA Hardiness Zones
The USDA first created the Hardiness Zone Map in 1960 as a resource for growers nationwide. Since its inception, the map has undergone several updates, reflecting changes in climate and advancing methodologies in data collection. The most recent update conducted by the Department of Agriculture occurred in 2023. This version utilized data from over 13,412 weather stations, illustrating shifts in the zones and indicating a warming trend across the country.
USDA Hardiness Zones in Illinois
Understanding the USDA Hardiness Zones is crucial for gardeners and farmers in Illinois, as these zones guide planting decisions based on the area's average minimum winter temperature.
Geographical Distribution of Zones
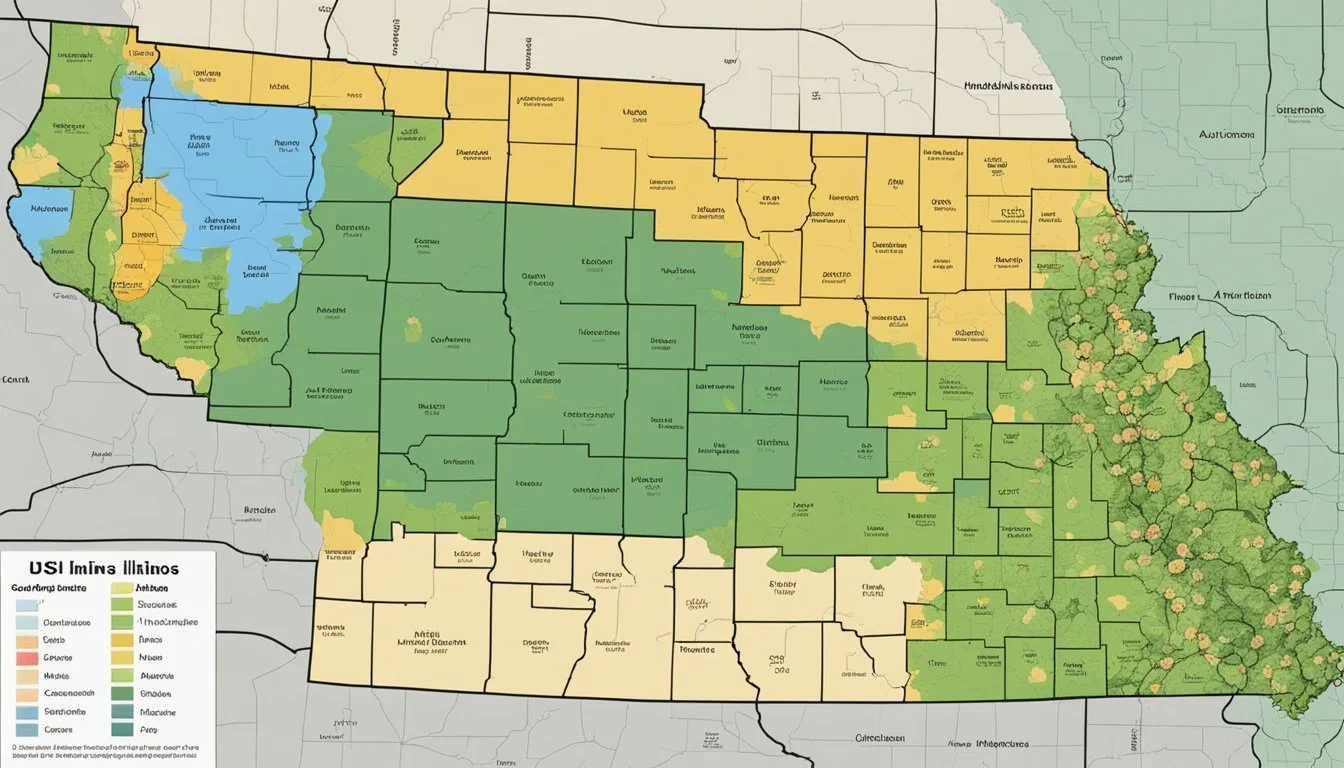
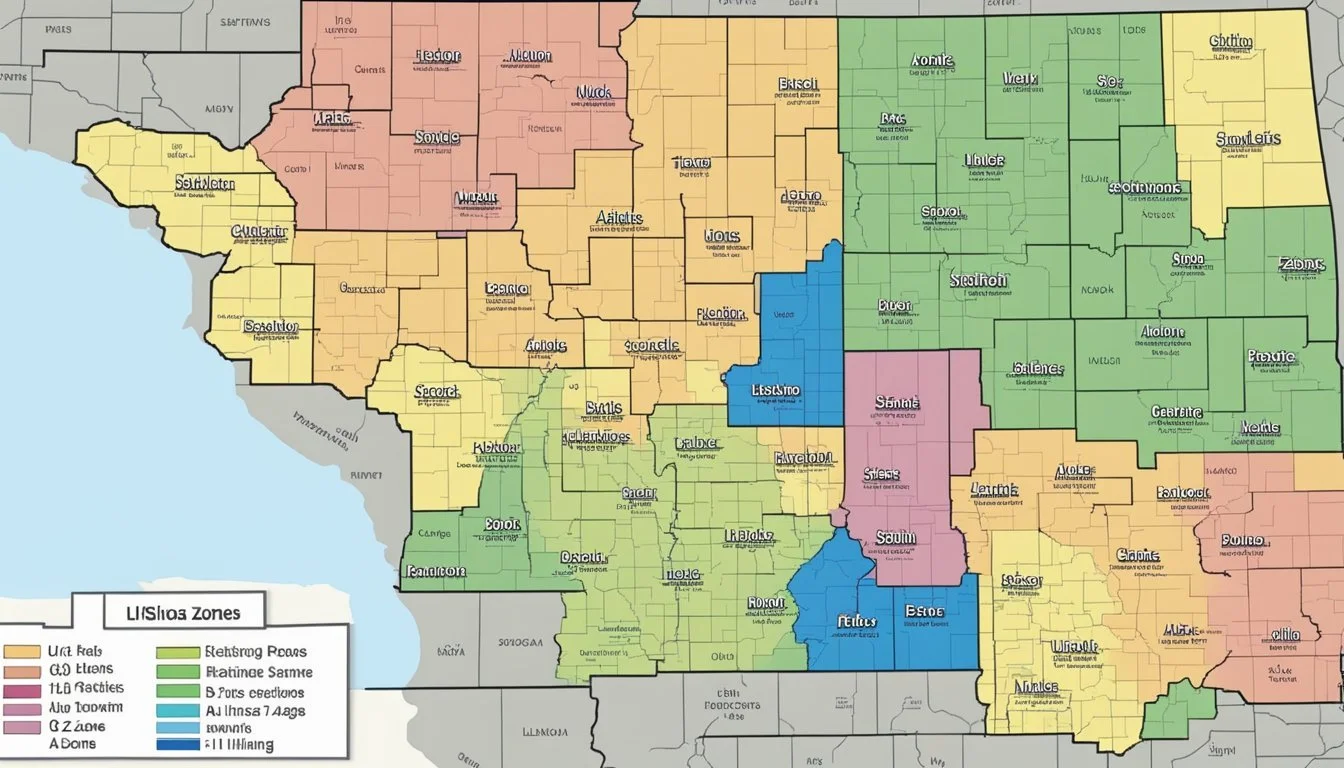
The USDA Plant Hardiness Zone Map segments Illinois into distinct zones reflecting the state's range of climatic conditions. In Northern Illinois, including the Chicagoland area, winter temperatures are cooler, placing it in zones 5a and 5b. Central Illinois is generally within zones 5b and 6a, with milder winters suitable for a variety of perennials. Southern Illinois experiences warmer temperatures, categorized in zone 6b, which allows for more diverse planting options due to its gentler winter climate.
Changes in Illinois' Hardiness Zones Over Time
Over the last 30 years, there has been a shift in Illinois' hardiness zones. This change is indicative of climate change and warming winters leading to a northward progression of warmer zones. The updated maps reflect this trend, showing a noticeable trend of winter warming, particularly in the northern and central regions of Illinois. The need to understand these alterations is underscored as gardeners adjust to the new realities of planting and growing in the state.
Agricultural Implications in Illinois
Recent updates to the USDA Plant Hardiness Zones reflect shifts in climate patterns, which have significant consequences for agriculture in Illinois. These changes affect the types of plants that can thrive, the strategies that farmers and gardeners employ, and may impact crop insurance guidelines.
Impact on Farmers and Growers
With the introduction of a new 7b zone in southern Illinois, farmers are observing a northward progression in warmer climates, which allows for the cultivation of crops previously unsuited for the region. Growers are adjusting their planting strategies, considering the cultivation of new perennial species and annuals that are more suited to the updated zones. This shift may lead to a need for modified crop insurance parameters as the agricultural landscape changes.
Crops: Adjustment in selection for hardier varieties or new species.
Crop Insurance: Potential revisions reflecting updated growth conditions.
Gardening and Landscaping Considerations
Gardeners and landscapers in Illinois must take note of the USDA Hardiness Zone Map changes to ensure successful horticulture and project planning. Landscaping designs may increasingly incorporate plants that were once considered too sensitive for Illinois climates. Knowledgeable selection of plants is crucial for long-term garden sustainability and to avoid the costs associated with replanting unsuitable varieties.
Gardens: Selection and longevity of suitable plants aligned with new zones.
Landscape: Implementation of adaptable and resilient plant varieties.
Scientific Basis of Zone Mapping
The USDA Hardiness Zone Map is a critical guide for gardeners and agricultural stakeholders, formulated using advanced GIS techniques and comprehensive temperature data to reflect the average annual extreme minimum temperatures.
GIS and Climate Data Analysis
Geographic Information Systems (GIS) are vital tools used by scientists in the creation of the USDA Hardiness Zone Map. This technology allows for the analysis and visualization of climate data on a spatial plane. Utilizing GIS and Climate Data Analysis, researchers integrate data from various sources, including thousands of weather stations, to produce a detailed map that reflects subtle nuances in climatic zones. The use of GIS aids in accommodating factors such as elevation, proximity to water bodies, and urban heat effects, which can all influence local temperature extremes.
Temperature Data and Zone Determination
The determination of USDA Hardiness Zones hinges on the collection of temperature data that reflects the average annual extreme minimum temperature. This figure is not a reflection of the lowest recorded temperature but rather an average of the lowest temperatures over a given period, typically 30 years. As climate change progresses, updates to these hardiness zones are critical, and are made possible by continuously collected temperature data. The establishment of zones, such as the 10-degree Fahrenheit intervals from zone 1 to 13, is grounded in data gathered from an expansive network of weather stations, diligently compiled and scrutinized by climatologists. This extensive process ensures that each hardiness zone confidently reflects the growth conditions plants are most likely to face in that area.
Environmental Changes and Zone Shifts

Recent climatological data suggests a clear northward progression of USDA Hardiness Zones in Illinois, attributed to factors such as global warming and urban development. These shifts have tangible implications for the region's horticulture and agricultural practices.
Global Warming and Zone Alterations
Global warming has led to alterations in climate patterns across Illinois, influencing the demarcation of USDA Hardiness Zones. Climatological winter temperature averages from 1991 to 2020 reveal that certain zones, such as 6a, 6b, and 7a, have migrated northward, signifying warmer minimum temperatures during the coldest part of the year. This trend was highlighted in the New USDA Plant Hardiness Zones Map published by the Illinois State Climatologist's office. The implications are critical for gardeners and farmers who rely on these maps for determining the most suitable plants that can thrive in their local climates.
Urban Sprawl and Microclimate Effects
The growth of urban areas, or urban sprawl, cultivates pockets of microclimates. Structures such as buildings and paved surfaces absorb heat differently compared to rural landscapes, often resulting in higher minimum temperatures that can affect plant hardiness zones within those urbanized areas. These microclimate effects have been observed in Illinois, where urban centers display slight yet notable deviations in hardiness zones compared to their surrounding rural counterparts. The phenomenon reflects on the New Hardiness Zone Map, suggesting that urban planning and expansion are crucial factors to consider when updating and analyzing hardiness zone data.
Planting and Conservation Strategies

In Illinois, gardeners and conservationists rely on the USDA Plant Hardiness Zone Map to guide their planting choices and conservation efforts. This tool ensures the selection of appropriate plants for the state's varying climates and plays a crucial role in biodiversity preservation.
Selecting Plants for Illinois Climates
When choosing plants for Illinois gardens and landscapes, gardeners should consider plant hardiness to match the state's climatic conditions. The updated USDA map has expanded the zones in Illinois, which affects plant selection and garden planning. For instance:
Zone 5b: Hardy perennials like the Purple Coneflower and Butterfly Milkweed are suitable.
Zone 6a: Gardeners can incorporate deciduous fruit trees such as Apple and Peach.
It's important for growers to prioritize perennial crops and native species that are well-adapted to their local zones, ensuring greater survival rates and less maintenance.
Conservation Efforts and Biodiversity
Conservation in Illinois entails protecting natural ecosystems and promoting biodiversity. Conservationists utilize the hardiness zone information to:
Identify native plants that support local wildlife and provide ecosystem services.
Encourage the use of diverse plant species to enhance genetic variety and resilience against pests and diseases.
Efforts such as establishing protected areas and encouraging natural landscaping in private gardens help maintain the state's biodiversity. By following the guidance of the USDA Hardiness Zone Map, individuals and organizations can contribute to a healthy balance between plant life and the environment in Illinois.
Understanding the Impact on Fauna
The adjustment of USDA Hardiness Zones in Illinois has implications beyond just plant cultivation; it significantly affects fauna, particularly in terms of habitat suitability and the prevalence of pests and diseases.
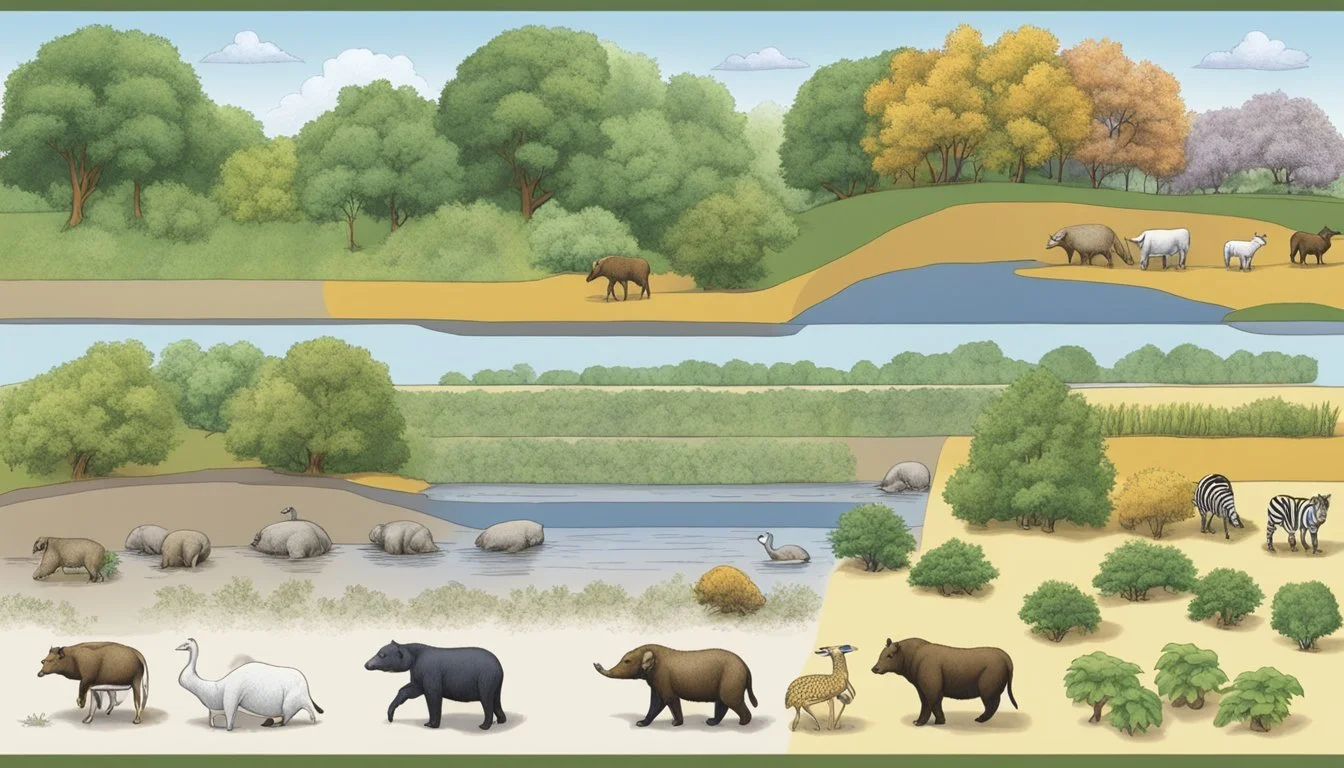
Plant and Animal Habitat Suitability
As the Hardiness Zones in Illinois shift northward, emphasizing the effect of a changing climate, there is a consequential impact on both plant and animal habitats. Animals that are suited to warmer climates may extend their range north, as they follow the zones that support the vegetation crucial for their survival. For instance, the expansion of zone 7b in southern Illinois invites a broader range of plants that, in turn, provide suitable conditions for certain wildlife species that were previously not found in this area.
At the same time, this shift can challenge species that are adapted to cooler conditions and are now facing habitat encroachment. Native species may struggle as their ideal living conditions are found further north, potentially bringing them into competition with other species. Additionally, the introduction of non-native, invasive plants may alter the natural habitat, further affecting local fauna.
Pests, Diseases, and Vectors
Warmer temperatures and altered landscapes play a role in the prevalence and geographical spread of pests and vectors that bring diseases affecting both plants and animals. With new zones establishing in Illinois, pests that favor mild winters can survive and proliferate more readily, which may lead to increased infestations and the spread of diseases. This is worrisome for farmers and conservationists alike, as they face the dual challenge of controlling pests and safeguarding animal health.
The arrival of pests previously non-existent in these regions may bring with them plant and animal diseases that local species are unprepared to resist. In this environment, vectors such as ticks and mosquitoes that transmit diseases flourish, presenting a heightened risk to both animal populations and humans. The higher temperatures could also accelerate the life cycles of these vectors, leading to more generations and a greater potential for disease transmission within a season.
Considerations for Human Well-being

Understanding the influences of USDA Hardiness Zones on human well-being in Illinois is critical, particularly in terms of health and economics. These zones not only dictate the types of plants that can thrive but also reflect the broader environmental conditions impacting daily lives.
Health Impacts of Climatic Variations
The northward progression of hardiness zones in Illinois suggests a warmer climate, which can affect human health significantly. For instance, milder winters may reduce the incidence of cold injuries like frostbite and hypothermia. However, these climatic changes could also yield to an increase in heat-related illnesses during expanded summer periods. These variations in temperature and weather patterns necessitate adjustments in public health planning and services to mitigate potential health risks.
Economic and Insurance Aspects
Economic activities, particularly in agriculture, are closely linked to hardiness zones. Crops previously unsuitable for certain regions may now thrive, altering the farming landscape. Yet, alongside new opportunities come risks, such as the potential for unseasonal temperatures or weather events that could damage crops. This uncertainty underscores the importance of crop insurance schemes, as they become key tools for financial planning and risk management in the face of changing climatic conditions. They provide economic protection for farmers, who must now navigate the less predictable elements of their planting and harvesting schedules.
Resources and Further Information
When seeking comprehensive information about USDA Hardiness Zones in Illinois, gardeners and agriculturists have a multitude of resources available. These resources help in understanding where specific plants can thrive across different climatic conditions.
Accessing the USDA Plant Hardiness Zone Map Online
The United States Department of Agriculture has developed the USDA Plant Hardiness Zone Map, which is an indispensable online tool for gardeners. This user-friendly map not only outlines the various zones within Illinois but across the United States as well. The map's interactive features allow users to zoom in to their specific location to find out their exact hardiness zone.
Supplemental Guides and eBooks
In addition to the online map, there are a number of supplementary guides and eBooks available that expand on the information provided by the USDA Plant Hardiness Zones. These digital resources often include plant profiles, cultivation tips, and climate adaptation strategies tailored to each hardiness zone. While some may be freely accessible online, others can be purchased for those looking for more specialized or detailed content.
Technical Aspects of Hardiness Zones
The USDA Hardiness Zones are categorical expressions of geographic areas where specific plant life is capable of growing based on climate conditions, particularly minimum temperatures. These zones are critical for gardeners and agriculturists aiming for successful plant growth and survival.
Zone Numbering and Classification
USDA Hardiness Zones are primarily delineated by 10-degree Fahrenheit increments, with each zone representing an area of winter hardiness for plant species. Zone 1 is the coldest, suitable only for the heartiest vegetation, whereas Zone 13 represents the warmest regions of the United States where tropical plants thrive. These designations assist growers in making informed decisions about which plants can survive and flourish in their local climates.
Detailing Half Zones and 10-Degree Fahrenheit Zones
For greater precision, the USDA divides each 10-degree zone further into half zones, denoted by “a” and “b”. The “a” half zone is 5 degrees colder than the “b” half zone, providing a more detailed guide for plant survival and light requirements tied to local weather patterns. For instance, Zone 5a indicates an average extreme minimum temperature of -20 to -15 degrees Fahrenheit, whereas Zone 5b represents -15 to -10 degrees Fahrenheit. This detail supports gardeners in selecting plants that will not only survive but also receive the necessary light and growth conditions to thrive.
Frequently Asked Questions
The USDA Hardiness Zone map is an essential tool for gardeners and farmers in Illinois. It guides planting schedules and crop selection based on local climate patterns.
How can I find my specific planting zone using my zip code in Illinois?
To find your planting zone in Illinois using your zip code, the USDA Plant Hardiness Zone Map provides an interactive tool that allows users to enter their zip code for a precise zone location.
What are the main climate zones for agriculture in Illinois?
Illinois features several climate zones ranging from Zone 5b in the northern part of the state to Zone 6b in the southern regions. These zones reflect variations in the average annual extreme minimum temperatures.
How do USDA Hardiness Zones vary across Illinois?
USDA Hardiness Zones in Illinois show a gradient from colder zones in the north to milder zones in the south. For example, northern Illinois areas may fall into Zone 5b, while southern areas may be classified as Zone 6b.
Where can I find an updated Illinois planting zone map?
An updated planting zone map for Illinois can be found on the Illinois State Climatologist’s website, reflecting the latest data.
In terms of planting and gardening, what zone does Chicago, Illinois fall into?
Chicago, Illinois mainly falls into Hardiness Zone 5b, meaning plant selection should be suited to this zone’s temperature range.
Is there a detailed map available that outlines the different hardiness zones within Illinois?
Yes, there is a detailed map available which outlines the different hardiness zones within Illinois. The interactive map available on the Plantmaps website provides a comprehensive view of the zones throughout the state.